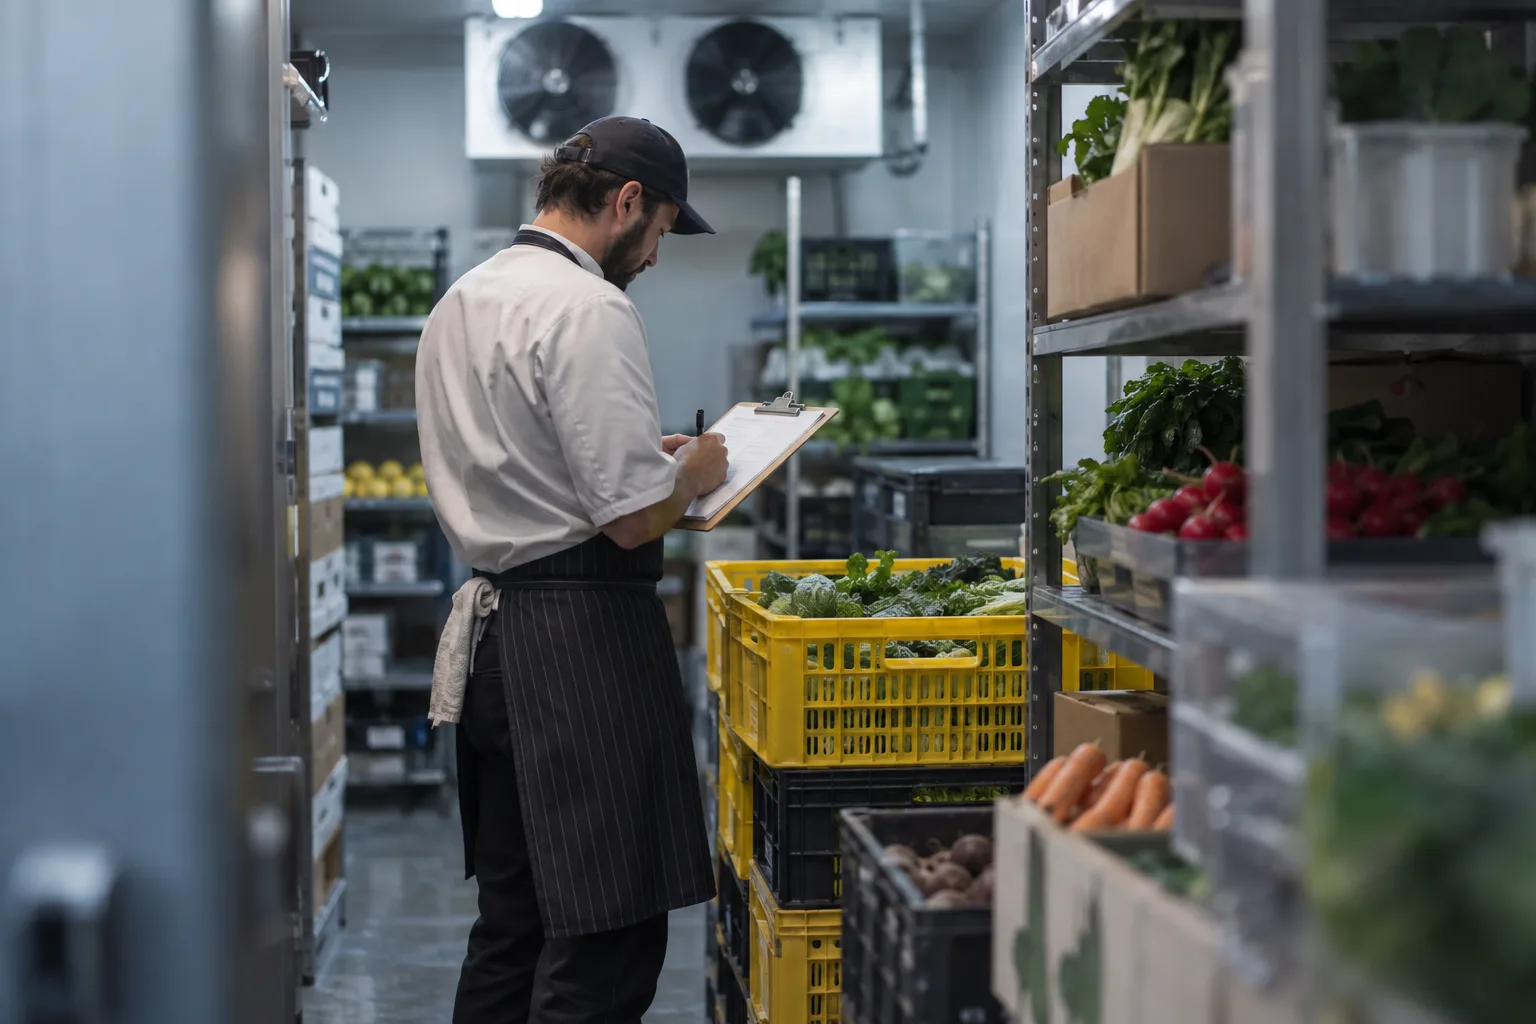
The monthly restaurant P&L from your accountant arrives around the 15th of the following month. By the time it tells you that food cost ran at 36% in March, you are halfway through April, the supplier has moved prices again, and the line cook who was over-portioning has been doing it for six weeks.
The monthly statement records what happened. A daily restaurant P&L gives you a number you can still change. Building one takes three data feeds and a spreadsheet, and the hard feed is the invoices.
What a restaurant P&L contains, and what a daily version drops
A full restaurant profit and loss statement runs from net sales through cost of goods sold, labor, operating expenses and occupancy to net profit. The daily version keeps the lines that move every day and that you can influence tomorrow:
| Line | Source | Why it is here |
|---|---|---|
| Net sales | POS | Everything else is a percentage of this |
| Food and beverage cost | Invoices received that day, or a running purchases figure | Largest controllable cost |
| Labor cost | Timeclock or scheduling tool | Second largest controllable cost |
| Prime cost | Food + labor | The one number that defines whether the day worked |
| Comps, voids, discounts | POS | Leading indicator for problems on the floor |
| Covers and average check | POS | Context for everything above |
Rent, insurance, loan payments and depreciation do not change on a Tuesday. Leave them for the monthly view. Multi-unit groups call the daily sheet a flash report.
Restaurant prime cost: formula and benchmarks
Prime cost is food and beverage cost plus total labor cost (wages, payroll taxes, benefits), as a percentage of net sales:
Prime cost % = (food and beverage cost + total labor) / net sales × 100
Most published guides put the healthy band at 55 to 65%. For a full-service independent, aim for 60 to 65%. Quick service can run 55 to 60. Above 68% for more than a few weeks, the business does not generate enough to cover everything below the line.
Example for a 100-seat restaurant on a Friday:
- Net sales: $9,400
- Food and beverage purchases attributed to the day: $2,900 (30.9%)
- Labor including taxes: $2,950 (31.4%)
- Prime cost: $5,850, or 62.2%
That is a fine day. Now the following Tuesday:
- Net sales: $3,100
- Food and beverage: $1,050 (33.9%)
- Labor: $1,520 (49.0%)
- Prime cost: $2,570, or 82.9%
Tuesday loses money. The monthly P&L blends that Tuesday with the Friday and shows 66%, which looks almost fine. The daily view shows that Tuesdays are overstaffed by roughly $500, which is $2,000 a month and $24,000 a year, visible only when you look at the days separately.
How to build a daily P&L from POS, invoices and labor
Sales
Pull net sales, covers, comps and voids from the POS every night. Toast, Square, Clover, Lightspeed and Syrve all expose this through reports or an API; POS integrations with Toast, Square, Clover and Lightspeed do the pull for you. Net sales means after discounts and comps, before tax and tips.
Food and beverage cost
This is the hard part, and the reason most single sites stop at a monthly P&L. Two ways to get a daily food cost:
- Purchases method. Food cost for the day equals invoices received that day. Simple, but lumpy. Use a rolling 7-day purchases total against rolling 7-day sales; that smooths deliveries out and gives a usable number within a week.
- Theoretical method. Food cost equals the sum of recipe costs for everything sold, from the POS item mix. Smooth day to day, but it needs costed recipes mapped to every POS item.
Start with rolling purchases and move to theoretical once recipes are costed. Either way, invoices need to be in the system the day they arrive, line by line; a stack of paper waiting for Friday is the reason the daily P&L does not exist.
Purchases only equal usage when opening and closing stock match, so run a 30-minute blind stock count each week. It turns the purchases number into a true food cost percentage and shows whether the daily figure has drifted.
Labor
Export hours and wage rates from the scheduling or timeclock tool. Add the employer’s share of payroll taxes and any benefits as a fixed percentage (10 to 15% on top of gross wages, depending on jurisdiction). Divide salaried managers by the days in the period.
Putting it together
A spreadsheet with one row per day and the columns above is enough to start, and it doubles as a restaurant P&L template for the weekly review. It needs sales, purchases and labor imported daily. If any of the three is manual, you will stop updating it within three weeks; plan for that rather than for discipline.
The four numbers to look at every morning
Look at yesterday and the trailing 7 days for:
- Prime cost percentage. Over 65% yesterday, on a normal sales day, is the signal to look at the next three.
- Food cost percentage, rolling 7 days. Up more than 1.5 points versus the prior week means a price move, a waste problem or a portion problem. The weekly variance count tells you which.
- Labor percentage by day of week. Compare yesterday’s Tuesday to the last four Tuesdays. Overstaffing shows up as a day-of-week pattern.
- Comps and voids as a percentage of sales. Above 2% on a day is worth a question. Above 2% for a week is a floor management or a theft issue.
Five minutes with coffee. Then the decisions: cut a server from Tuesday, call the supplier about the chicken price, put a scale on the line.
The weekly rhythm
Daily numbers show that something changed. The weekly review is where you decide what to do:
- Monday morning, 20 minutes: last week’s daily P&L, prime cost by day, top five food cost variances from the weekly count, labor versus schedule.
- Monday afternoon: next week’s schedule adjusted using last week’s day-of-week labor percentages.
- Wednesday: supplier price alerts from the week’s invoices; any call to a supplier happens here.
- Friday: quick look at the week so far against the same week last month.
That is about 90 minutes a week, and it replaces the monthly surprise.
What goes wrong
- You enter invoices in batches, so food cost swings and nobody trusts it. Fix: capture invoices at delivery.
- You pull labor from the schedule rather than actual hours. Fix: use the timeclock export.
- Sales include tax or tips. Fix: net sales only, and check the definition once.
- Stock goes uncounted, so purchases drift away from usage. Fix: a weekly count, even a short one.
- A large invoice lands on the 1st for goods used last month. Fix: date purchases by delivery and let the 7-day roll absorb it.
Where bilz fits
Daily P&L is rare because it needs three data feeds every day, and the invoice feed is the one that breaks. bilz connects to the POS for sales, captures invoices by photo or email at delivery with line-level OCR, and takes labor from your scheduling tool, so the four morning numbers are on your phone before the first delivery. The daily P&L is one of the back-office features included at $149 per location per month. The structure above is enough to try the method in a spreadsheet first.
Frequently asked questions
What is included in a restaurant P&L?
Net sales, cost of goods sold (food and beverage), labor, operating expenses such as supplies and marketing, occupancy costs such as rent and utilities, and net profit. The daily version keeps sales, COGS, labor, prime cost, comps and covers, and leaves the fixed lines for the month.
What is a good prime cost for a restaurant?
Between 55 and 65% of net sales, depending on concept. Full-service independents run close to 60 to 65; quick service and bars can hold 55 to 60. Sustained weeks above 68% leave too little for rent, marketing and profit.
How often should a restaurant review its P&L?
Four daily numbers each morning, a 20-minute weekly review on Monday, and the full monthly statement when the accountant sends it. The daily and weekly views are where you change staffing and purchasing.
Why is a monthly P&L too late?
It arrives two to six weeks after the costs happened, so the supplier price, the over-portioning and the overstaffed Tuesday have all run for another month. A daily view shows the same number while you can still change next week’s schedule or order.